

I’ve been involving myself with battery testing, at times quite intensively, testing various primary cells and rechargeable cells. Most of the tests of rechargeable cells have been Li-Ion, Li-Polymer and even Sealed Lead-Acid since they’re all similarly easy to test with an unambiguous CC/CV current-termination type charging scheme.
The notable absentee is (the now less-popular) Ni-MH chemistry which I’ve always meant to delve into, but felt it to be a bit troublesome. Now that I have a high precision Keithley 2450 SMU, I think it’s time to take a closer look at Ni-MH charging and cycling.
The Trouble with Ni-MH
Lithium-based and lead-acid-based rechargeable batteries are easy to deal with – the CC/CV regime can easily be replicated by most laboratory bench power supplies and the termination criteria can be easily implemented just by reading the current until it falls to a given value and then turning off the power supply or disconnecting the battery.
A Ni-MH cell is a bit more finicky – charging is nominally by constant current at a range of possible rates but the termination criteria can be one of several:
- Voltage-based criteria – this includes voltage “stagnation” during the end of charge, sometimes called 0dV/dT and voltage “droop” when approaching overcharge which is often advertised as -dV/dT. Such changes are often noted to be small, in the mV scale depending on your charge rate although absolute values are hard to come by. The termination signal can be easy to miss amongst the natural “noise” of the charging process. As a result, high accuracy seems to be a must but alternative backup methods are imperative.
- Temperature-based criteria – often used as a backup termination, this method senses the cell temperature rate of rise (dt/dT) or by a threshold temperature (e.g. 50 degrees C). This relies on the fact that a cell that is overcharged runs a parasitic reaction that generates a number of byproducts, one of which is heat.
- Time-based criteria – sometimes used as a backup for safety in case of a cell anomaly, but other times used as the primary-mode of termination especially in slow (i.e. C/10 or less) chargers.
There is also the “oddball” possibility of constant voltage charging which I’ve experimented with and seen (seemingly) implemented in a commercial product. I don’t recommend it, but over-voltage termination could be workable as an additional safety.
Getting charging right can be a challenge, especially if you only have a limited sensing capabilities (e.g. no temperature). Some effects are dependent on the charge rate relative to the cell capacity. But getting it right is critical for almost all tests. In the case you fail to terminate on a high-rate charge, cell venting and loss of electrolyte is likely which would rapidly cause a decrease in cell capacity especially if the vent fails to seal afterwards. Loss of cycle life is also associated with the loss of cell capacity. Extreme cases could possibly cause cell rupture. On the other side, if one were to be too conservative, an underestimation of cell capacity would occur which may be “unfair” for the cell if we are trying to gauge absolute capacity. The key to a proper capacity test starts with being able to charge the cell correctly!
The easiest way to get things right might be just charging the cell at a slow trickle (C/10 or C/20) for about 1.5x the capacity to compensate for charging inefficiencies at low rates and then test the capacity afterwards, noting that the “mild” overcharge should not do any permanent damage to the cell aside from warming it ever so slightly. The big downside is that this limits the cycling throughput to around once a day … too long for cells which might be claiming as much as a 2500 cycle lifetime. It is also not representative of actual use where faster chargers (e.g. 15-minute or 1 to 2-hour) might be used.
This is why I thought it to be prudent, given that I have the equipment, to do a bit of a dive into what happens when you charge a Ni-MH cell at different rates and try to implement an algorithm that can safely cycle cells without necessarily requiring additional hardware other than the SMU.
Trying it Out

To test it out, I grabbed a Keystone Electronics 1028 AA holder from the parts box and wired it up in a four-wire connection set-up with some shielded banana plugs harvested from low-cost test leads which were previously modified with different plugs.

To produce a four-wire connection, I soldered the power supply wire to the “frame” of the terminal, while soldering the sense lead to the rear of the leaf spring contact at the point where it would touch the cell. I know this is not “ideal” as there could be electric field spreading influences, but this is much better than two-wire. Likewise, the use of “commercial” battery holders which are not metrology-grade also imposes limits with regards to contact pressure reliability and current carrying capacity. For the purposes of this experiment, it is still likely to be sufficient.

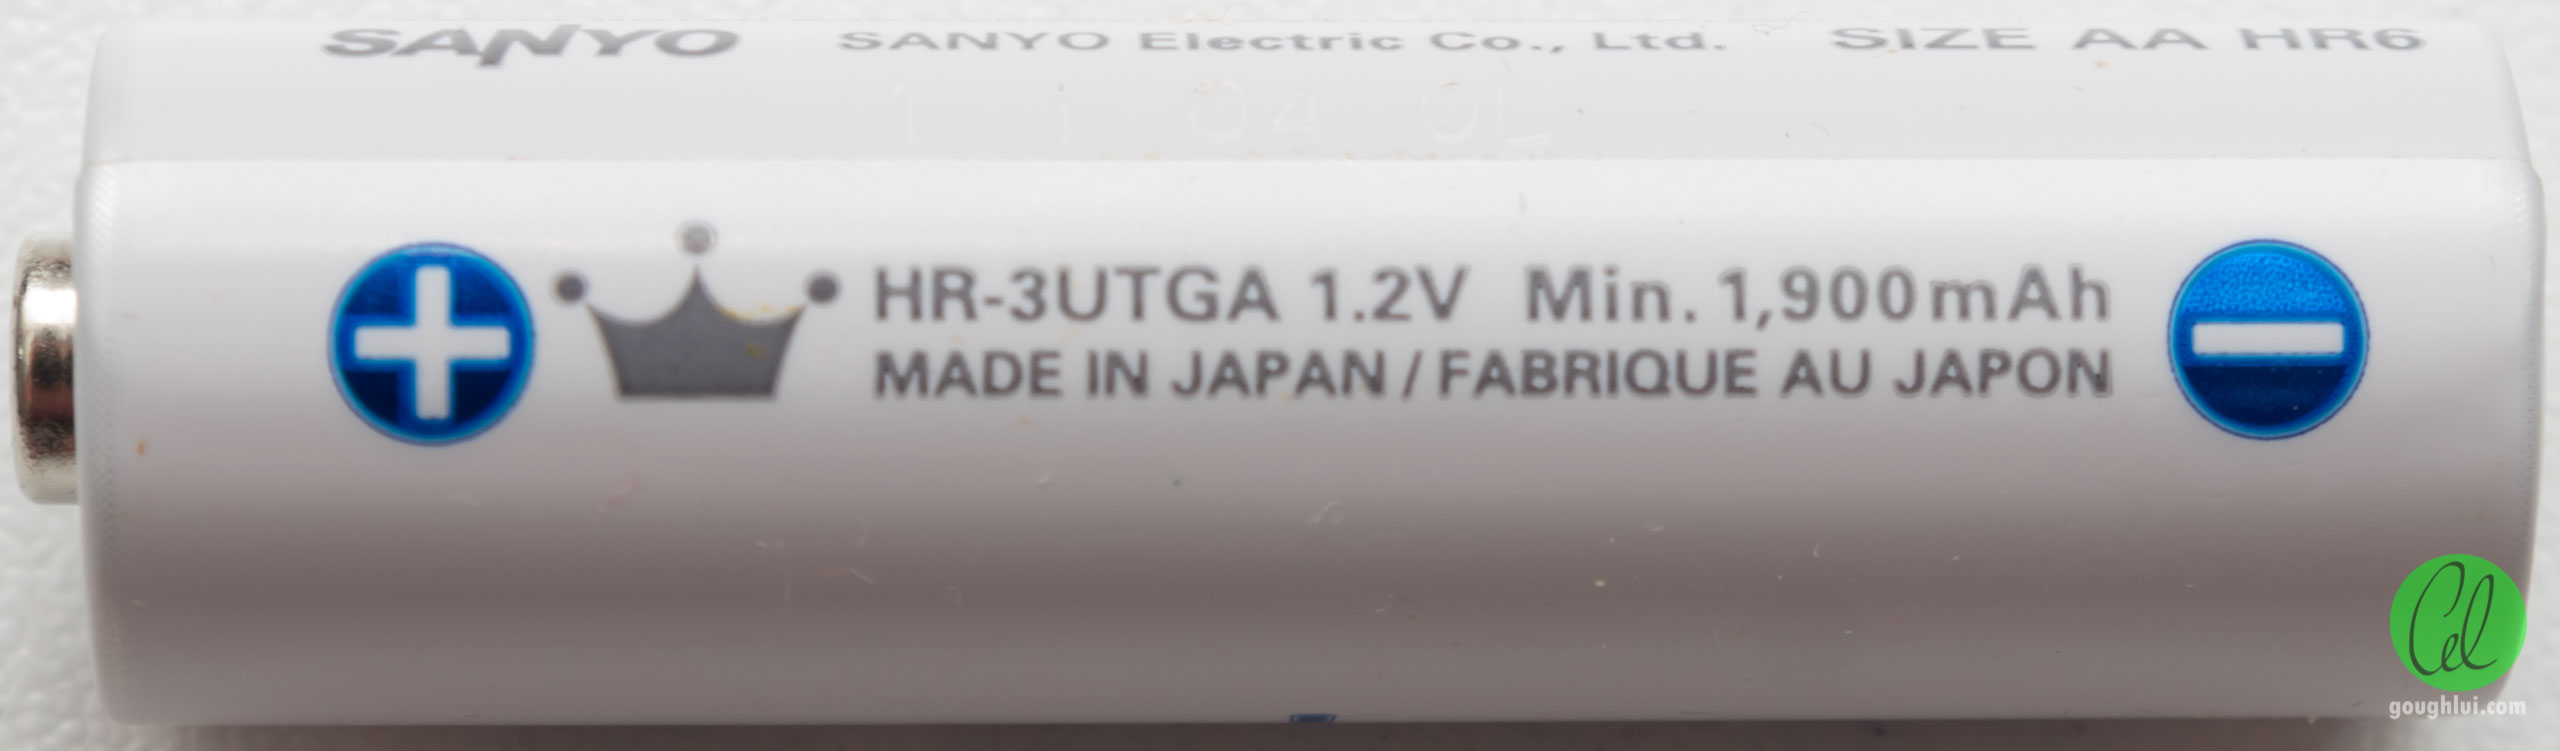
The sacrificial battery is a Made-in-Japan Sanyo Eneloop HR-3UTGA from the April 2011 batch. This particular type of cell is prototypical of a high-quality, durable, 2nd-generation low-self-discharge cell and should make a fine example. It just so happened to be sitting on my desk for a while, not being used much, so I decided it could be sacrificed if needs be … all in the name of science.


For the purposes of initial testing, I decided that measuring the cell temperature was also important, so a TM Electronics K-type bare-bead thermocouple was taped to the cell, making direct contact with the shell of the cell through an aperture cut into the label in the approximate centre of the cell.
Test equipment used included a Keithley 2450 SourceMeter (source/load voltage/current with four-wire sensing at 10PLC) and a Keithley 2110 5.5-digit Digital Multimeter (for temperature). Testing was coordinated using a pyvisa script I wrote that:
- First discharges the cell at 1A constant current until its voltage reaches 0.8V to establish an empty-cell baseline.
- Provides a constant current to the cell at a fixed current value.
- Records voltage/current/temperature datasets as frequently as possible.
- Terminates charge when the temperature reaches 50 degrees Celsius or charging time indicates that a capacity of 1.8-times the capacity of the cell has been delivered (i.e. 3600mAh).
- Repeats the process for all fixed current values – 1A, 750mA, 670mA, 500mA, 330mA, 250mA. This corresponds to a charge rate of 0.5C, 0.375C, 0.335C, 0.25C, 0.165C, 0.125C respectively.
Unfortunately, the 2450 SMU’s current envelope which only reaches 1A means that “high-rate” charging above 0.5C could not be tested. While I could have employed my R&S NGM202 to push the current up to 3A (1.5C), my NGM202 was busy on another assignment and I wasn’t convinced the battery holder would provide good-enough contact at such current levels. Usually AA cells are only used up to a current level of about 700mA before their internal resistance and heating can cause unusual results to appear.
Testing Results

As testing was conducted in ambient conditions, the tests were somewhat vulnerable changes to ambient temperature which provides the “baseline” temperature. During charging, we can see that the cell temperature rise versus capacity delivered into the cell is very consistent – about 1900mAh, the temperature begins to rise. At 1A, charging was terminated on over-temperature as the 50 degree C threshold was reached. At lower rates, the heat evolved was not sufficient to bring the cell up to the threshold, so it just simmered in the warm state until the charge timer expired and terminated the charge.
Key observations include a “rapid” increase in dV/dT as the cell approaches full charge, then -dV/dT at full charge followed by the temperature rise which is registered soon after.

The choice of -dV/dT is supported by the fact it seems to occur just ahead of the temperature rise of the cell. However, as expected, the amount of “droop” you get is very dependent on the charging current – at 1A, it is quite clear with an amplitude of around 50mV, but at 250mA, a “plateau” forms instead as it transitions from charging to a parasitic reaction. Even at 500mA, it seems the voltage is affected by the thermal condition of the cell, so it may not show as a clear “signal” – the amplitude would only be about 5mA. This illustrates exactly why -dV/dT is not a good choice for slow charging. Plotted versus capacity above, we can also see the noise that is observed in the charging voltage which can jump up and down a little over time.

But the graph above is deceptive, as things really happen with time and not so much capacity. So when plotted against time, the differences in the shape of the peaks are quite apparent – at low charge rates, the -dV/dT is quite gentle.
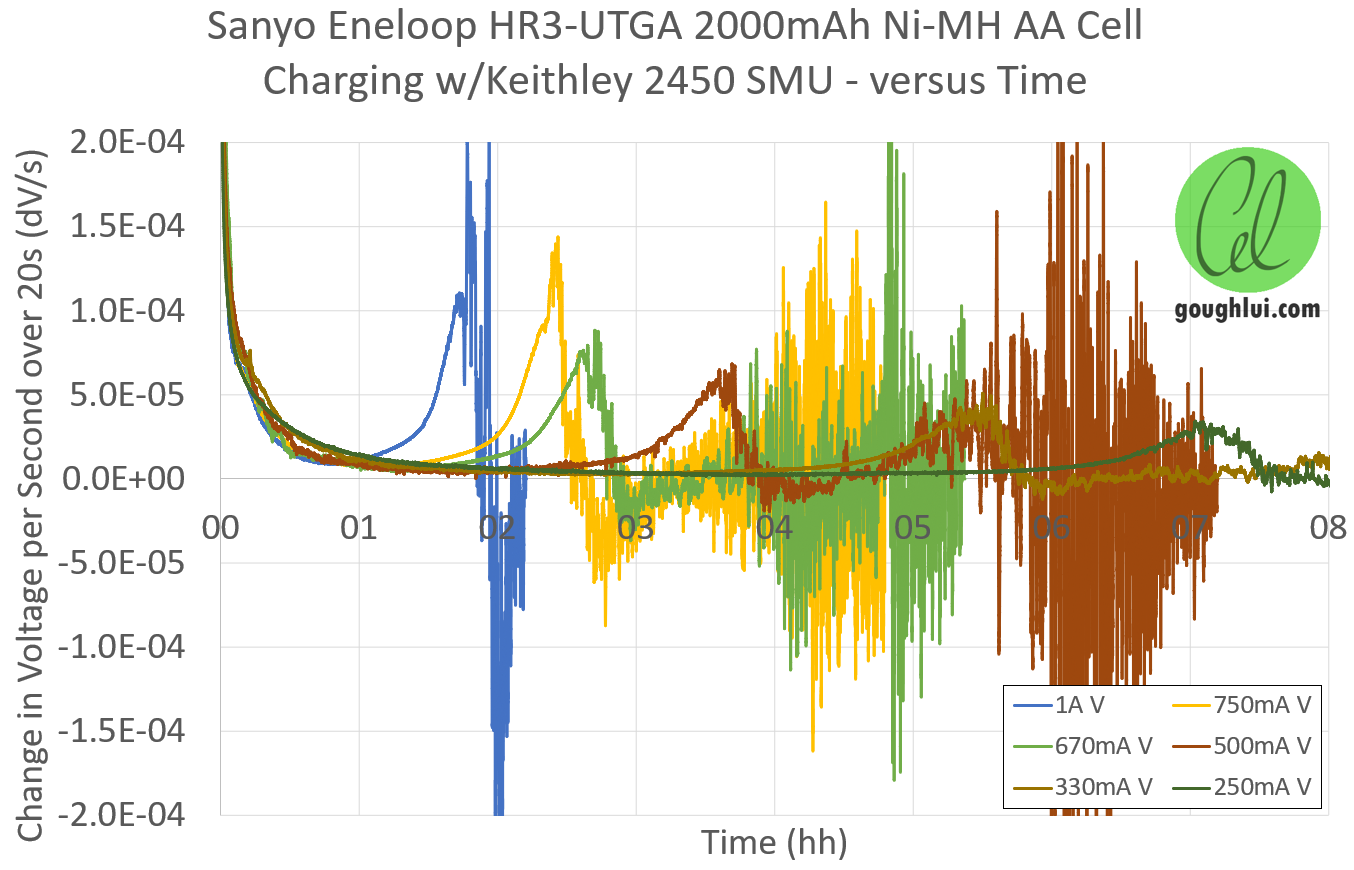
Calculating the dV over 20s, we get this graph – it seems that the approach to full charge is quite clear in the steep increase in voltage change rate, but the -dV is not as clear with noise and only subtly dipping below the zero line.
Based on these observations, it seems that temperature is quite a “foolproof” termination – the signal is strong, but since it lags the full-charge condition, the cell may have accumulated some damage prior to registering termination. This would cause a reduction in cycle life. It is also inconvenient, requiring additional equipment.
By contrast, the positive dV/dT seems to be quite a good indicator of approaching full charge, but terminating on this is likely to cut the cell short with regards to its capacity. Instead, it seems a 0dV/dT strategy looking for the peak which may “degrade” into a -dV/dT strategy would probably be best. Because of the noise involved, averaging over a time-period is necessary and perhaps multiple confirmatory readings are necessary to terminate and avoid a false termination due to noise.
Another back-up may be the choice of an over-voltage termination – it seems that the cell did not exceed about 1.7V charging at 1A, so that could be used as an additional layer of protection.
The resulting data also showed that I had a misconception about the efficiency of a Ni-MH cell – I’ve always believed them to be about 66% coloumbically efficient, but actually, they’re closer to 100%. This misconception probably arose because I saw commonly that cells would be specified to be charged at a constant current rate of C/10 for 14-16 hours. But apparently, this has to do with the cell being less accepting of charge at lower rates and losing charge through self-discharge (which is probably not an issue with this particular type of cell). Hence my time-termination choice actually caused gross overcharge in this experiment.
That being said, this Eneloop cell seemed to do a great job of tolerating the “stressful” forced overcharge to obtain this data – it did not seem to vent and the capacity remained consistent throughout the tests. That was surprising to me … so I suppose we should continue on with the experiment and try some (gentle) torture …
Cycling a Cell
Taking what I have learned above and putting it into practice, I decided to code up a script that would cycle the same cell above. It would use a 0dV/dT or -dV/dT style algorithm that would kick in above 1.55V (to avoid false early termination), averaging readings over 20s periods to detect the number of voltage plateau or regressions and terminate once that reached a fixed number. This was backed up by a timed termination at 1.2x the rated capacity to avoid gross overcharge and an over-voltage termination at 1.7V. I have provided the code in Appendix A at the end of the post with no warranties implied.
I had intended to run the script for about 50 cycles, but just prior to the 50th cycle, a mishap caused the script program to be terminated – let it be known that one should double-check PIDs when they’re issuing a kill command!
Anyhow, the data retrieved from this test was gigantic – once imported to Excel for analysis, the file blew out to about 650MiB and was slow as molasses to work with.

What it showed was that my algorithm was not perfect – as a first attempt, I didn’t expect it to be. It also showed that the process is temperature sensitive, something that is to be expected. The first cycle resulted in early termination, so the data was removed, but the cell seems to have been “conditioned” on the next cycle and followed a regular pattern from then-on.
The blue line shows the delivered charge into the cell, while the orange line shows the discharge capacity of the cell. The gap between the two lines represents the “efficiency”, but also potentially the “overcharge” delivered into the cell, which seemed to reduce over time.
The below graphs concentrate on the details of three of the more interesting cycles.

The reason for this is because of a subtle issue I didn’t expect – it seems that we were tripping out on over-voltage rather than dV/dT on the later cycles as the cell seemed to develop a sharper, peakier voltage rise towards the end. This may be partly due to ambient temperature differences – note the shifted voltage curve of cycle 21, but also due to changes in the internal condition of the cells. As a result, the later charges probably terminated a hair early but my guess is not significantly so.

Zooming in, we can see that at least on Cycle 4, the dV/dT algorithm probably did get a few instances where the “noise” may have delayed termination slightly, but it certainly cut-out before any major -dV/dT occurred, which is a good result.
The overall capacity fit was not all that great with an R-squared of 0.55, but the rate of decrease is about 0.8mA/cycle. This implies with a 2000mAh cell, it would take about 500 cycles to fall to 80% of the rated capacity. Looking around, I found AA Cycler’s test of a later Panasonic eneloop using a smart charger and he reported cycle lives of 420 for a March 2016 cell and 462 for a August 2019 cell based on testing to failure. Considering that I only tested 50 cycles and assumed a linear degradation rate, the numbers are remarkably similar despite earlier noting that the charge/discharge protocol is probably key for achieving high cycle lifetimes.

Discharge curves are nothing too special to look at – however, perhaps cutting-off early on over-voltage has been kinder to the battery to the point of reducing the loss of capacity per cycle.

As I had paired data, I could look at the coulombic efficiency of my charging algorithm. High values near 100% are actually to be expected when you avoid overcharging the cell and the fact that the first plotted cycle has the highest efficiency is correlated with a lower delivered capacity shows this point quite well. The intervening cycles are terminated based on 0dV/dT or -dV/dT which show lower efficiencies about 97% which may be due to some overcharging occuring. Above this, the voltage-termination cycles show higher efficiencies around 98.5%. This was not what I had expected based on my early naive understanding of the chemistry, but it seems the result is to be expected, and the confusion was purely my own doing.

Calculating the round-trip energy efficiency, I get values of about 74% which is better than I expected, but this basically is due to the difference between the charging voltage and discharge voltage as the cell was pretty close to 100% coulombically efficient.
On the whole, the testing went smoothly and the Keithley 2450 SMU proved to be a valuable asset in providing clean and highly accurate readings of voltage and current while doing both charging and discharging. The one thing I found a bit unfortunate was the amount of heat generated when sourcing/sinking 1A which caused quite a bit of fan noise and consumed a correspondingly notable amount of electricity. This trade-off is not unexpected compared with more conventional single/two-quadrant supplies, but it seems that the 2450 may have a heatsink and thermal probe dedicated for sinking circuitry and another dedicated for sourcing circuitry. As a result, switching from charging to discharging actually caused the fan to spin down and then rapidly spin back up as the “other” heatsink got hot which was a little distracting. Other than that, it was solid as a rock under remote command and didn’t cause a single issue despite operating for a week non-stop to deliver these results.
Conclusion
To be able to properly determine cell capacity or cycle a battery requires being able to charge it consistently and preferably optimally in a way that doesn’t contribute to damaging the cell (as much as possible). While Ni-MH as a chemistry is quite old and supposedly well understood, charging them safely and properly can be a little difficult as some of the parameters are not so openly discussed and many just fall-back upon the low-rate trickle charge just to avoid getting it wrong.
My understanding of Ni-MH prior to these experiments was proven to be incomplete especially with regards to coulombic efficiency. After performing the tests, I can now see how 0dV/dT and -dV/dT are desirable termination strategies but also understand the difficulty of measuring such small signals especially at low charge rates or when thermal effects could dominate or cause false signals. I also illustrated how dt/dT provides a clear signal of overcharge, but the inconvenience of requiring additional measurement hardware is why it is perhaps not as often used. I was also able to see a strong +dV/dT signal prior to reaching full charge which could be easier to see but results in incomplete use of the full cell capacity.
I implemented a cycler script, which isn’t perfect and saw false termination on the first charge and also ended up tripping over-voltage termination which was perhaps too sensitive and didn’t account for cell ageing and other effects. However, it was respectful of the cell (for the most part) and seemed to produce a figure (perhaps by coincidence) with cell cycle life that is corroborated by other testing.
It can definitely be improved, but I can definitely say that I’m not as “afraid” of getting it wrong with fast-charging Ni-MH now that I can understand what the constant-current charging voltage curve is telling me about the charge status of the cell. As for multi-cell packs … I suppose that’s a whole different kettle of fish when mismatched cells start corrupting the signals causing false peaks/troughs.
Appendix: Ni-MH Cycler Script
Attached below is the “quick and dirty” cycler script which is invoked through a Python 3 interpreter and uses pyvisa for communications.
# Gough Lui's "Quick and Dirty" Ni-MH Cycler Script - Jan 2021 (goughlui.com)
# Free to modify and use - no warranties expressed or implied. Use at your own risk.
# No liability accepted for any damage incurred, no matter how it arises.

import visa
import time

resource_manager = visa.ResourceManager()
ins_k2450 = resource_manager.open_resource('TCPIP0::192.168.80.19::inst0::INSTR') # Set resource string to match your device!

# Roll Call
print("Available:" + "\n" + ins_k2450.query('*IDN?'))

# Set Up K2450
print("Setting Up - K2450")
ins_k2450.write('OUTP 0')
ins_k2450.write('DISP:DIG 6')
ins_k2450.write('VOLT:NPLC 10')
ins_k2450.write("SOUR:FUNC VOLT")
ins_k2450.write("SOUR:VOLT:RANG 2")
ins_k2450.write("OUTP:VOLT:SMOD HIMP") # Output Off is High Impedance to prevent stress/stray current draw
ins_k2450.write("CURR:RSEN 1") # Four-wire sensing mode

# Begin Voltage Experiment
print("Begin Testing")
input("Prepare for Test - Press Enter to Continue")
for cyclecnt in range(0,1000) : # Number of cycles to perform set to silly-high number
  # Discharge Cell
  print("Opening a logfile for Discharging Cycle #"+str(cyclecnt)+"...")
  f = open("nd"+str(cyclecnt)+".csv","a")
  ins_k2450.write("SOUR:VOLT 0.79")
  ins_k2450.write("SOUR:VOLT:ILIMIT 1.0")
  ins_k2450.write("OUTP 1")
  print("Status Line\r",end="")
  while True :
    smuvol = ins_k2450.query_ascii_values('READ? \"defbuffer1\",SOUR, READ')
    f.write(str(time.time())+","+str(smuvol[0])+","+str(smuvol[1])+"\n")
    print(str(time.time())+","+str(smuvol[0])+","+str(smuvol[1])+"               \r",end="")
    f.flush()
    if smuvol[0] < 0.8 : # Discharge Termination Voltage
      ins_k2450.write("OUTP 0") # Output is turned off between experiments - risk of relay wear as using HIMP output off mode!
      break
  f.close()
  print("")

  # Open Log to Charge
  print("Opening a logfile for Charging Cycle #"+str(cyclecnt)+"...")
  f = open("nc"+str(cyclecnt)+".csv","a")
  ins_k2450.write("SOUR:VOLT 1.80")
  ins_k2450.write("SOUR:VOLT:ILIMIT 1.0")
  ins_k2450.write("OUTP 1")
  print("Status Line\r",end="")
  startt = time.time()
  termalg = 0    # Termination algorithms activation flag
  termprevt = startt
  termprevv = 0  # Previous period average voltage
  consecz = 0    # counts number of times a 20s average sees a voltage stagnation (0dV) or negative trend (-dV)
  termvlist = [] # Buffer to hold averaging window worth of voltage readings for 0dV/-dV determination
  termcurv = 0   # Current period average voltage
  while True :
    smuvol = ins_k2450.query_ascii_values('READ? \"defbuffer1\",SOUR, READ')
    f.write(str(time.time())+","+str(smuvol[0])+","+str(smuvol[1])+"\n")
    f.flush()
    print(str(time.time())+","+str(smuvol[0])+","+str(smuvol[1])+","+str(termalg)+","+str(termprevt)+","+str(termprevv)+","+str(consecz)+"              \r",end="")
    # Termination Condition Tree
    if time.time() > (startt+(3600*2/1*1.1)) :
      f.write("Terminated by Time!")
      print("\nTerminated by Time!")
      break;
    if smuvol[0] >= 1.70 : # Over-voltage Termination - perhaps a little low depending on temperature, as I found
      f.write("Terminated by Over-voltage!")
      print("\nTerminated by Over-voltage!")
      break;
    if smuvol[0] >= 1.50 :
      if termalg == 0 :
        # Reached 1.50V - Termination Algorithm Active. Prevents early-early termination due to charging voltage instability
        termalg =1
    termvlist.append(smuvol[0])
    if time.time() > termprevt + 20 : # Sets averaging time window
      termprevt = time.time()
      termcurv = sum(termvlist)/len(termvlist)
      if (termcurv-termprevv < 0) and termalg == 1 :
        consecz = consecz + 1
        if consecz == 4: # Four instances of voltage stagnation/reduction
          f.write("Terminated by dVdT!")
          print("\nTerminated by dVdT!")
          break
      # Uncommenting below resets count meaning the count will be of consecutive 0dV/-dV events, making it less likely
      # to terminate, at the risk of additional overcharging
      #else :
      #  consecz = 0
      termprevv = termcurv
      termvlist = []
  ins_k2450.write("OUTP 0")
  f.close()

# Announce Completion
ins_k2450.close()
print("Script Completed!")
Alternatively, you may download the code as a ZIP file.