

I think there’s no doubt that I love solid state drives. Can’t have enough of them. While on a “per gigabyte” basis, they look expensive compared to hard drives, their true economy is in saving time and improving performance. To that end, their price is now extremely acceptable.
Sandisk is one of the biggest and most trusted names in flash memory, and their SSDs have been thoroughly deployed in OEM solutions, and also in some corporate/datacentre applications. However, when it comes to consumer SSDs, their products have hardly made great strides, but maybe that’s about to change.
One surefire way to get me to buy something is to put a good price on it, and the nice guys at Scorptec ran a promotion (since ended), selling the Sandisk Extreme II 480Gb for AU$259. It came out to a total of AU$268.16 when all the shipping and payment surcharges were added in, but that’s still about 56c/Gb, roughly value SSD territory for something that should give the Samsung 840 Pro a run for its money.
Having recently just purchased an SSD, I wasn’t really in the market for another. However, I couldn’t sleep that night, and at 1am, decided to order it and put my mind at ease. It wouldn’t be like me to let this opportunity slip by.
Unboxing
The Sandisk Extreme II is a bit of an unusual beast. It’s probably now considered so old that it has “fallen off” the list of products on Sandisk’s SSD page. Details are still available on Scorptec’s product page.
Having previously shelled out for three rather unexciting but solid Sandisk Extreme SSD’s in the past (Sandforce SF-2281 with Toggle NAND), I’m well familiar with Sandisk’s rather compact packaging and “bare” inclusions. As it turns out, the Sandisk Extreme II is no different, as the successor to the original.

The name is gold-foiled on the front, for that additional touch of luxury. The front clearly indicates that the kit includes a spacer, for converting the 7mm-height drive to a 9.5mm height.

There is not much to say about the rear – the box is fairly small and is very similar to the earlier Extreme box in having a viewing window to see the serial number of the drive inside. The drive itself is warranted for five years, which is rather good (and generous), although leading-edge drives are starting to be warranted for ten. In most cases, users will already be upgrading to something better by then.

As promised, the plastic spacer comes in a plastic bag. The rear has self-adhesive strips to stick it to the drive. There are two leaflets – an installation and warranty guide, and a special warranty statement for Australia and New Zealand.

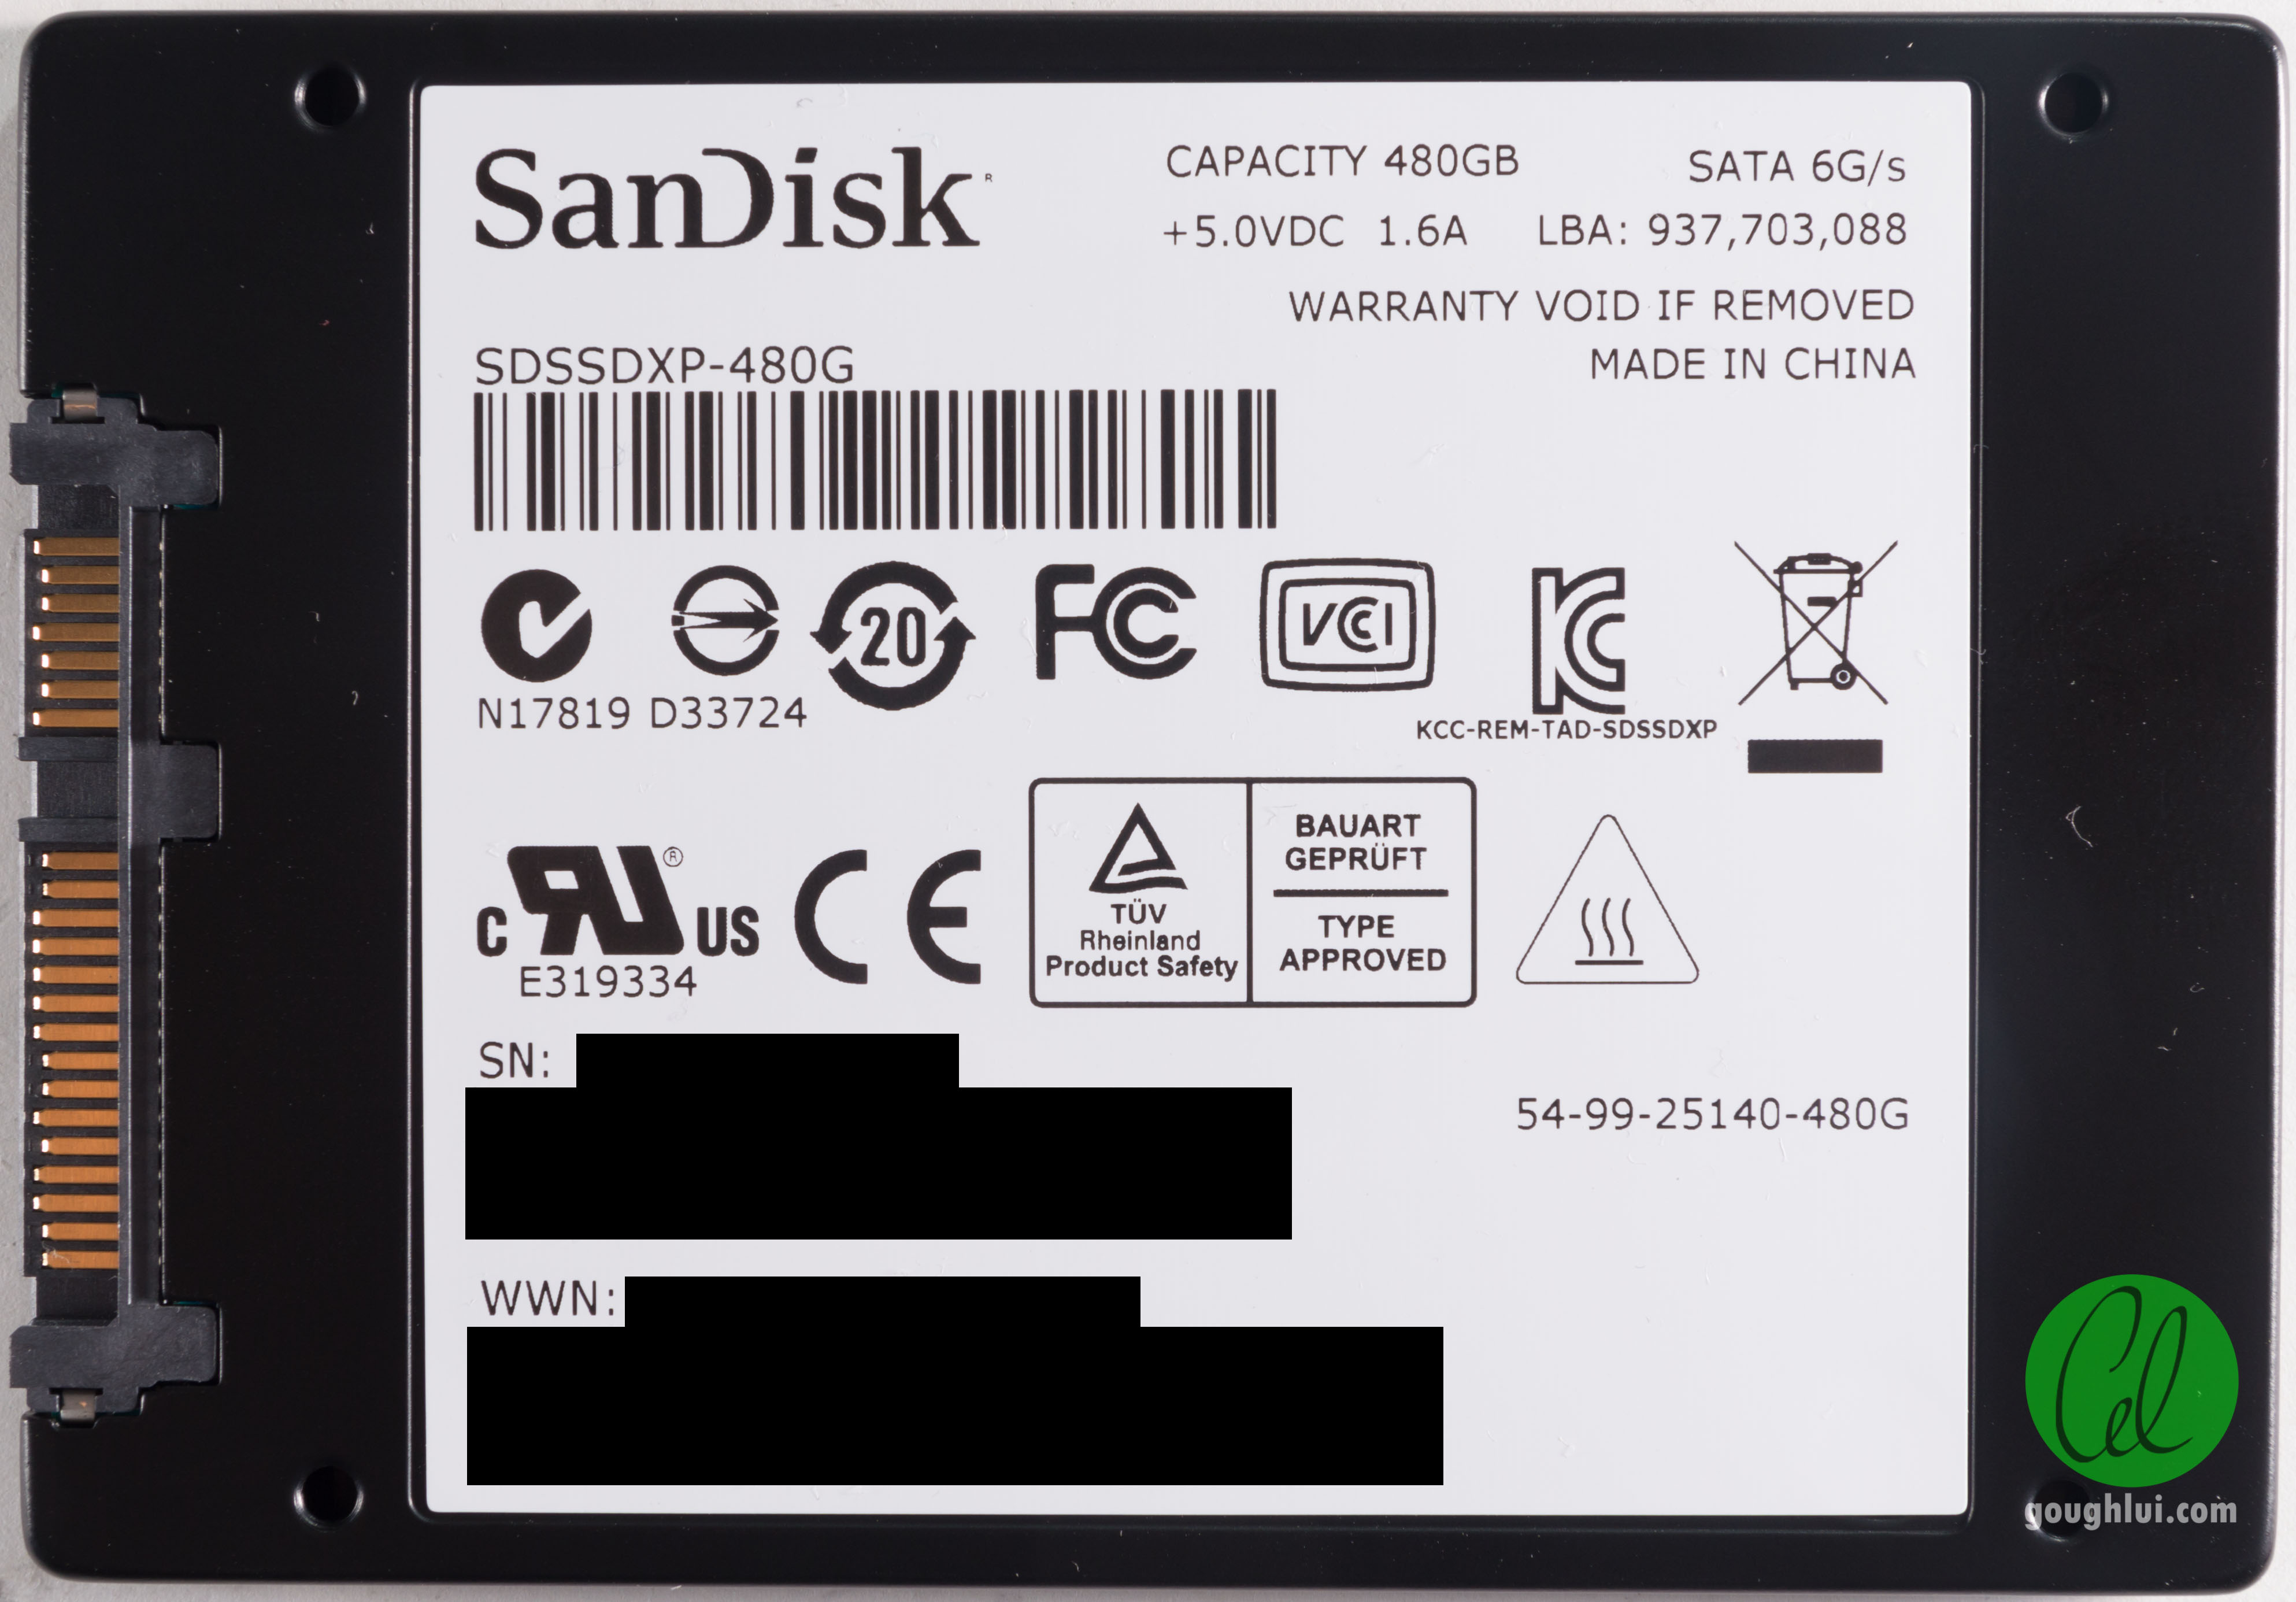
And of course, we have the 7mm height drive. It seems this drive is Made in China, and is assembled from a hybrid construction of a plastic top and a metallic bottom.
Teardown
Lets just say that the warranty on this unit didn’t last ten minutes – I decided to tear it apart right away. The drive itself is constructed with four Philips head screws, secured under the corners of the white label. Removing the four screws allows the plastic top cover to be popped off.

As is the case even for the previous Sandisk Extreme SSD, the PCB is bright blue in colour. Disappointingly, we are met with a top which consists of many surface mount points for surface-mount tantalum capacitors which are not fitted. As a result, the drive itself doesn’t have any strategic reserve of power to aid in preventing data corruption on loss of power. Maybe this is an option which is fitted for some of their business series SSDs.
Smaller capacitors for bypassing the power at each flash chip are provided on this side, which is a rather unusual arrangement.

On the other side of the PCB, we can see that the drive has a full complement of eight flash memory packages, branded and marked Sandisk. It is likely that the flash totals to 512Gb, with 480Gb user accessible and the rest reserved for overprovisioning. The power for the chips are supplied through a pair of TI switching converters, for efficiency.
The SSD is built with a Marvell 88SS9187 controller, likely with Sandisk’s own firmware. This is used with a Samsung K4B4G1646B-HCK0 4Gbit (512Mb) DDR3 1600Mhz (11-11-11) chip as a DRAM buffer.
The PCB part number is 54-50-05103-R1, and is consistent in the copper traces and silkscreen.

In a positive move, the metallic bottom is used as a heatsink, and thermal pads are used to transfer the heat from the chips to the casing. The screws provide the necessary force to ensure good contact.
Performance Testing
Testing was performed as per the previous SSD tests. The testing platform is an AMD Phenom II x6 1090T BE @ 3.90Ghz running on a Gigabyte 890FXA-UD7 running Windows 7 64-bit edition with the latest patches. The on-board chipset SATA 6Gb/s ports were used with the AMD SATA drivers to interface with the drive. TRIM was enabled on the system. The drive was subjected to a full random fill, and multiple-readback to verify data integrity of all sectors, which it passed.
SMART Data


SMART data was read using CrystalDiskInfo v6.1.14 (latest at the time of writing). The left screenshot shows the data of the drive as new, and already shows 2Gb of reads and writes, 13 power on counts and 2 unexpected power losses. As the drive was sealed, this is likely to be manufacturer testing related. The majority of the SMART attributes are understood and well defined, making lifetime determination more reliable.
From a guess at looking at the final values, A8 may represent number of cycles on most worn block, A6 may represent the number of writes on the least worn block and E6 the average number of cycles across all blocks. The way the Power-on-Hours current value is used is very unusual, starting at 100 for 0 hours and then counting upward as each hour elapses.
HD Tune Pro Sequential Read

The drive puts out a pretty normal performance, pretty much getting close to saturating the SATA3 link as most drives do. The access time seems to be a little on the higher side which might affect IOPS performance.
Drive             Average Read  Access Time
Sandisk ExtII 480Gb      515.4        0.130
Transcend SSD340 256Gb   512.9        0.069
Intel 730 240Gb          512.6        0.104
Kingmax Xvalue 240Gb     514.7        0.061
Samsung 840Pro 256Gb     527.3        0.047
Crucial M500 240Gb       296.4        0.037
HD Tune Pro Sequential Write

The write performance was pretty consistent across the drive, without any real slow-downs or slow patches. This is expected given the overprovisioning that the drive is manufactured with. The write speed itself is pretty good, and the access time is much more competitive.
Drive             Average Write  Access Time
Sandisk ExtII 480Gb       428.1        0.041
Transcend SSD340 256Gb    297.7        0.052
Intel 730 240Gb           263.0        0.042
Kingmax Xvalue 240Gb      265.7        0.038
Samsung 840Pro 256Gb      440.0        0.041
Crucial M500 240Gb        209.6        0.045
HD Tune Random Access Read

It seems the earlier note for the access time is borne out in the HD Tune Random Access benchmarks. The overall IOPS scores here fall behind most of the SSDs tested to date, which is somewhat disappointing.
Drive                   512b   4K     64K    1Mb  Rand IOPS
Sandisk ExtII 480Gb     7973   6950   2375   395  660
Transcend SSD340 256Gb 12240   6992   3617   466  857
Intel 730 240Gb         9624   8243   2956   440  763
Kingmax Xvalue 240Gb   13721   6519   1999   430  749
Samsung 840Pro 256Gb    8340   8145   4093   477  879
Crucial M500 240Gb       N/A    N/A    N/A   N/A  N/A
HD Tune Random Access Write

The write performance is a lot more competitive, so it seems this drive is geared more towards optimizing write I/O performance. Maybe this is a side effect of their caching strategy.
Drive                   512b   4K     64K    1Mb  Rand IOPS
Sandisk ExtII 480Gb    23589   20375  5451   383  784
Transcend SSD340 256Gb 26490   16397  2240   117  237
Intel 730 240Gb        22980   19414  5534   311  669
Kingmax Xvalue 240Gb   26120   21794  5489   255  501
Samsung 840Pro 256Gb   23211   19755  5596   430  827
Crucial M500 240Gb       N/A    N/A    N/A   N/A  N/A
CrystalDiskMark

The drive puts up a strong performance in CrystalDiskMark, especially when it comes to 4k accesses, where it opens up a decent margin over the 840 Pro in single read and write and queued read commands.
Drive                 SeqR  SeqW  512kR 512kW 4kR   4kW   4kR32 4kW32
Sandisk ExtII 480Gb   521.6 439.0 315.7 412.7 33.81 84.78 279.5 239.0
Transcend SSD340 256Gb506.6 315.2 440.7 317.6 29.53 80.50 246.2 244.4
Intel 730 240Gb       462.9 296.8 383.2 295.6 33.78 85.43 285.3 251.9
Kingmax Xvalue 240Gb  516.8 280.9 381.1 280.8 27.27 85.56 261.8 232.5
Samsung 840Pro 256Gb  523.5 448.6 329.5 427.6 23.20 81.28 190.1 248.8
Crucial M500 240Gb    475.2 283.6 421.2 282.5 26.23 86.09 255.9 242.6
AS SSD Benchmark

The strong performance continues in AS SSD, with slight differences in numbers. Notably, the delay in read access times seems to disappear when it comes to this particular benchmark, and may be a limitation in HD Tune Pro instead. In total score, it turns out the highest score in my set of SSDs of 868, which is nine points ahead of the Samsung 840 Pro.
Drive                SeqR  SeqW  4kR  4kW  4kR64 4kW64 AcR   AcW   Score
Sandisk ExtII 480Gb  510.5 423.7 31.1 75.7 264.5 218.7 0.043 0.048 868
Transcend SSD340 256G514.2 300.0 27.4 72.1 232.2 217.3 0.055 0.049 789
Intel 730 240Gb      512.8 279.5 30.0 73.0 262.7 210.1 0.046 0.048 831
Kingmax Xvalue 240Gb 514.2 265.3 25.3 75.0 247.6 201.8 0.046 0.048 790
Samsung 840Pro 256Gb 511.0 439.0 30.8 73.1 255.1 224.4 0.059 0.047 859
Crucial M500 240Gb   493.1 273.7 24.2 75.9 241.7 208.1 0.047 0.066 786
AS SSD Copy Benchmark

Fairly respectable numbers here, no surprises I suppose.
AS SSD Compression Benchmark

No evidence of compression is visible in this benchmark. Performance is consistent across all types of data.
ATTO Disk Benchmark

The drive shows fairly strong write performance, with the performance already reaching near-peak at 32kB transaction sizes. The read and write performance is fairly balanced under Atto’s workload, which is good for a system with mixed workloads.
Anvil’s Storage Utilities

It seems that Anvil doesn’t like this drive as much as the Samsung 840 pro, however, it still puts in a very good result.
Drive                Score
Sandisk ExtII 480Gb  3860.20
Transcend SSD340 256G3772.04
Intel 730 240Gb      3842.91
Kingmax Xvalue 240Gb 3381.02
Samsung 840Pro 256Gb 4150.13
Crucial M500 240Gb   3737.94
H2testw

I’m glad to report no corruption issues were experienced with the drive under H2testw, although the read performance is capped due to CPU-limitations in the program.
Power Consumption
Testing for power consumption was performed on another system with only a SATAII port. As a result, the drive was only put under a “moderate” load for these measurements – full heavy workloads may see higher current consumption. The current was recorded at about 29 readings per second while the drive ran a full CrystalDiskMark run.
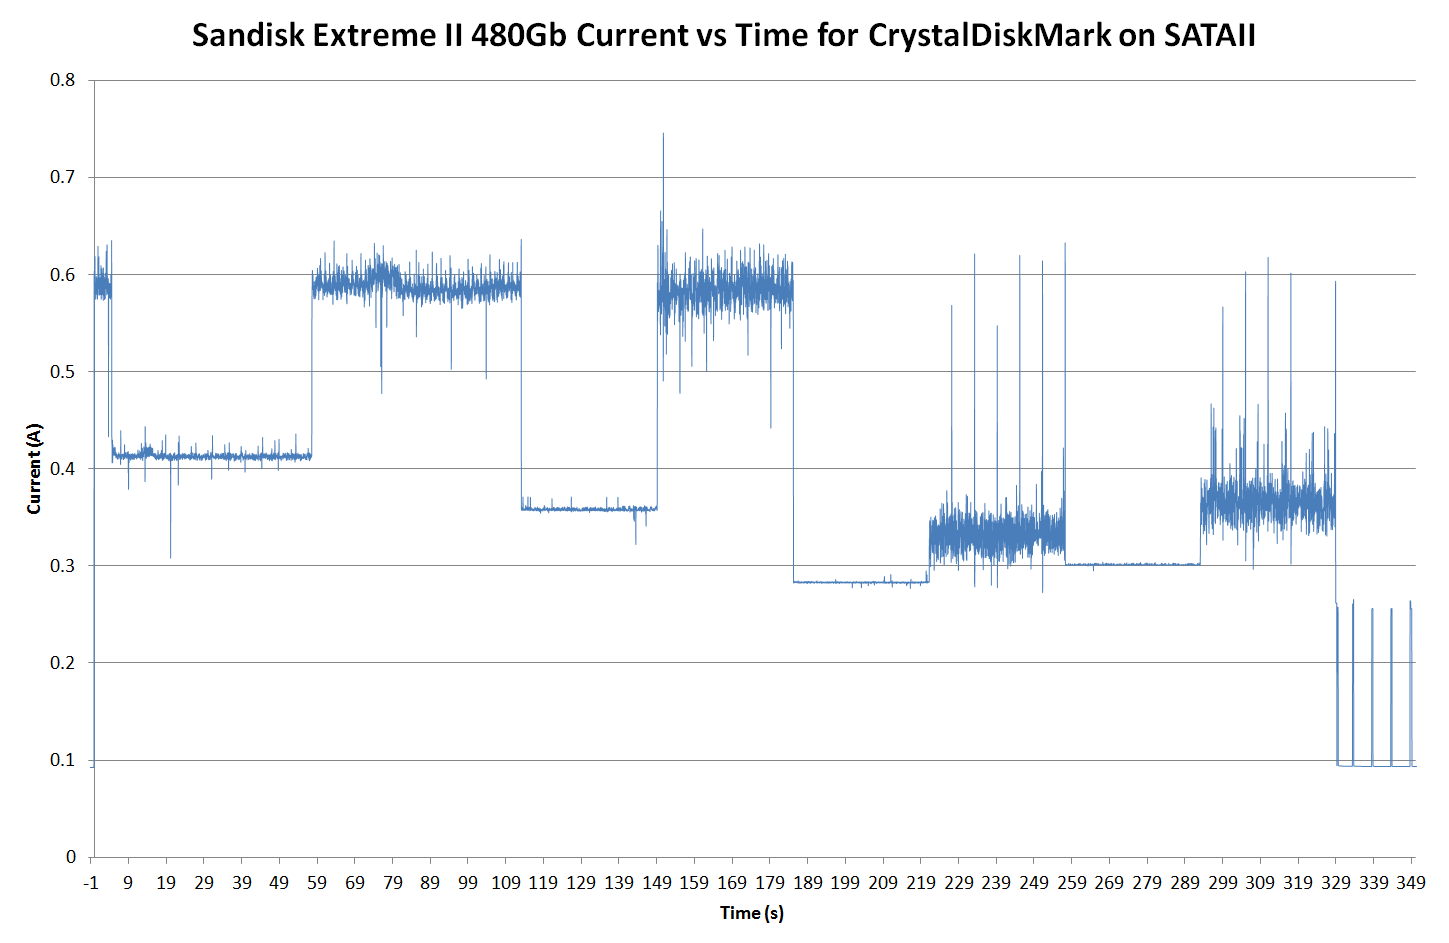
The current profile for the drive does have some spikiness, but not as extreme as other drives. At the conclusion of the test around 329s, the drive returns to idle consumption with periodic spikes for the next 30-or-so seconds as it seems background garbage collection is being performed.
The current consumption was averaged for the idle, sequential read and sequential write phases for comparison.
Drive                           Idle    Read   Write
Sandisk Extreme II 480Gb        93.1mA  413mA  589mA
Transcend SSD340 256Gb          109mA   255mA  519mA
Crucial M500 240Gb              186mA   289mA  538mA
Kingmax SME35 Xvalue 240Gb      60.5mA  216mA  513mA
Kingston V300 120Gb             119mA   372mA  590mA
Samsung 840 Pro 256Gb           59.7mA  300mA  386mA
Western Digital WD1600BEVS      220mA   680mA  700mA
It’s a bit unfair to compare drives of different capacities in terms of power consumption, as the number of flash dies that need to be powered will often contribute to increased power consumption. Indeed, this seems to be the case when it comes to the read power consumption of this drive, which seems to be the highest amongst the solid state drives tested to date and nearly equal highest power consumption for write.
A redeeming factor is a lower idle power consumption, although the Samsung 840 Pro consumes less in all phases.
Conclusion
The Sandisk Extreme II drive is a high-performance SSD which can keep up with the likes of the Samsung 840 Pro. While the inclusions in the package are rather bare, and the power consumption of the drive is a little higher than most, the price of the drive is rather attractive if you can get it on promotion as I did. It provides “performance” line results at a value-line price. It’s a little disappointing that Sandisk didn’t include any power loss protection, but it seems that the Samsung 840 Pro doesn’t either.